Stats and reports – overview
Our stats include the traditional web metrics (such as visitors and page views) as well as additional metrics (form submissions, calls, map clicks or coupon redemptions) that provide deeper insight into your site’s interactions and conversions. To access the stats and reports, click on the Stats / Reports link on the site dashboard:
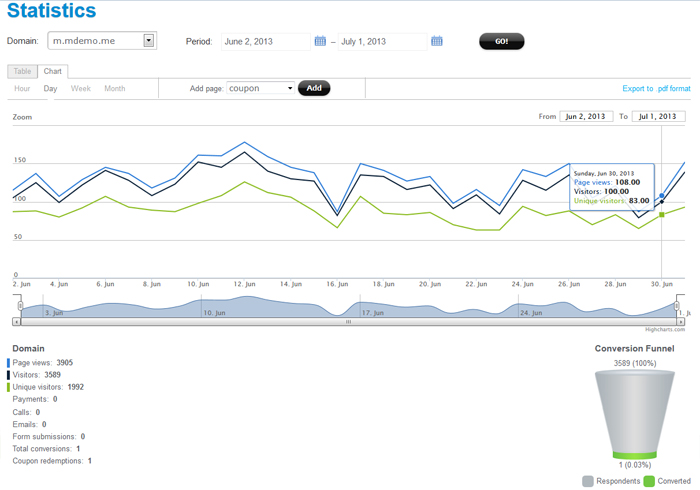
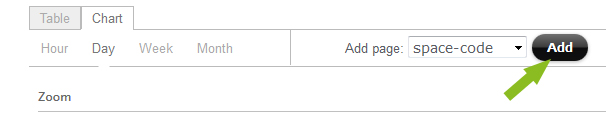
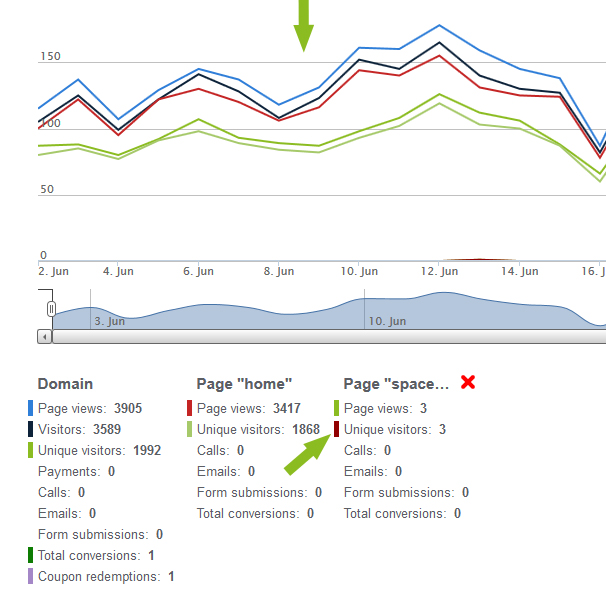
You can customize the reports by adding metrics – site or page performance indicators, such as calls, form submissions or map clicks, per page:
To add more metrics to the visual graph, click on metrics in the legend below the graph. A color indicator next to the metrics means that the metric was added to the graph:
Reports can be downloaded as a PDF file – for sharing with your clients.
Stats can also be embedded in external applications or sites. Simply click on “Show Iframe link” at the top of the report for instructions.
Tutorial video: custom forms, stats and reports
(3 min)